4CHAB (ForciHab)
TEL experiment
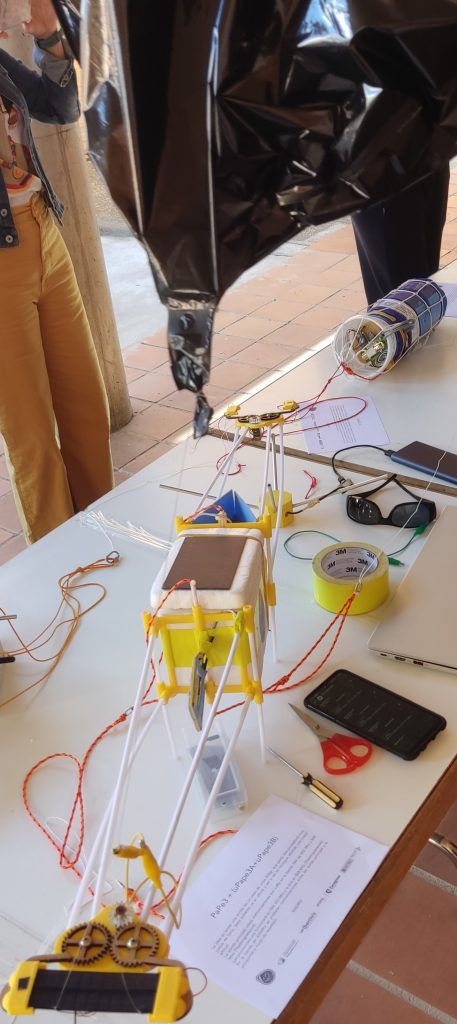
The rope-cutting experiment did not work as expected. The sample rope was left uncut.
The main reason for the failure was the discharge of the 9V battery carried to produce the cut. The battery’s state was checked and it was found to be completely flat, at 7.64 V. The normal value would be 9.6 V.
A visual inspection of the casing of the MOSFET used indicates that current flowed through it for a period of time. The casing heated up and partially melted, but nothing serious. This indicates that current, at a very low voltage, was flowing through it for some time, but it was not enough to produce any effect.
2C experiment
The experiment worked partially, as telemetry was obtained up to 3,000 metres. It is suspected that it could not go further because of the antennas fitted at the ground station, which were very small.
Rules Engine experiment
It worked perfectly; the system generated the control tokens as planned.
Chicken Wings (The Air and Space Box Program)
Biological
In Servet 5 we were able to confirm that potatoes suffer necrosis from freezing. But dehydrated legumes survive the low temperatures and radiation without problems. As for the germination of lentils, no differences were seen in growth compared with the control samples germinated at the same time. This year Ginkgo biloba seeds were sent up, which are currently being stratified to germinate them in spring, when we will begin the comparative follow-up with the control samples.

Communications:
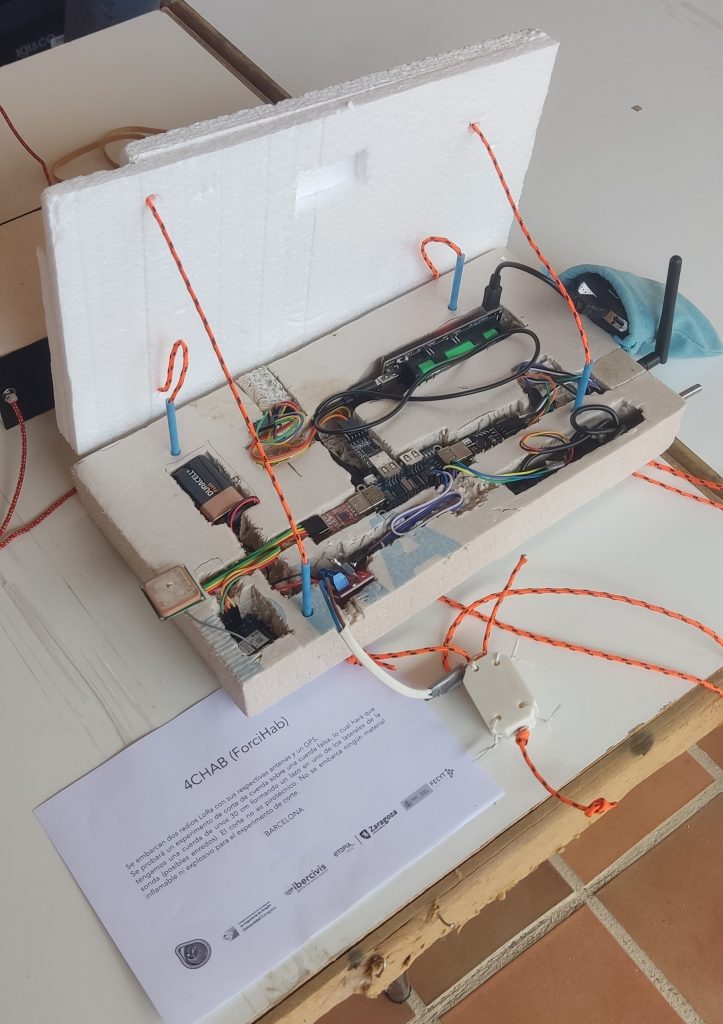
LoRaWAN: we achieved quite wide coverage even though, because of a configuration fault, the device was silent above 12,000 metres. Coverage was practically uninterrupted during the flight.

LoRa
The auxiliary device, with only 10 mW, worked very well, complementing the LoRaWAN signals and reporting the probe’s status.
Tracking
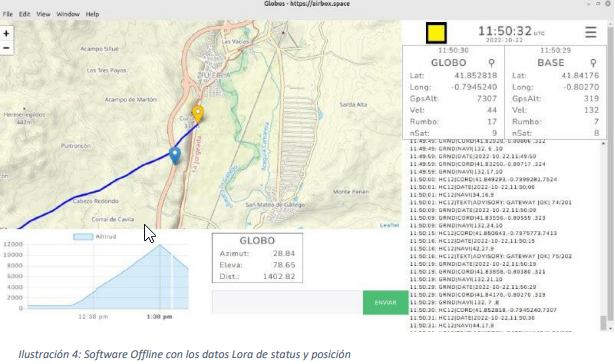
The prediction software made a very accurate calculation of the landing site, which made the recovery easier for us. The Telegram channel for tracking worked correctly. The offline software showing the probe’s status and position also worked correctly. We now have to download the data from the database for review.

Stabilisation system
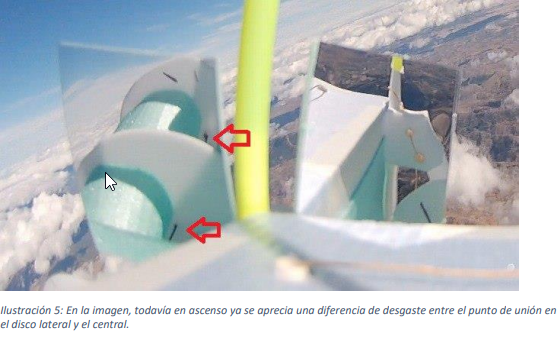
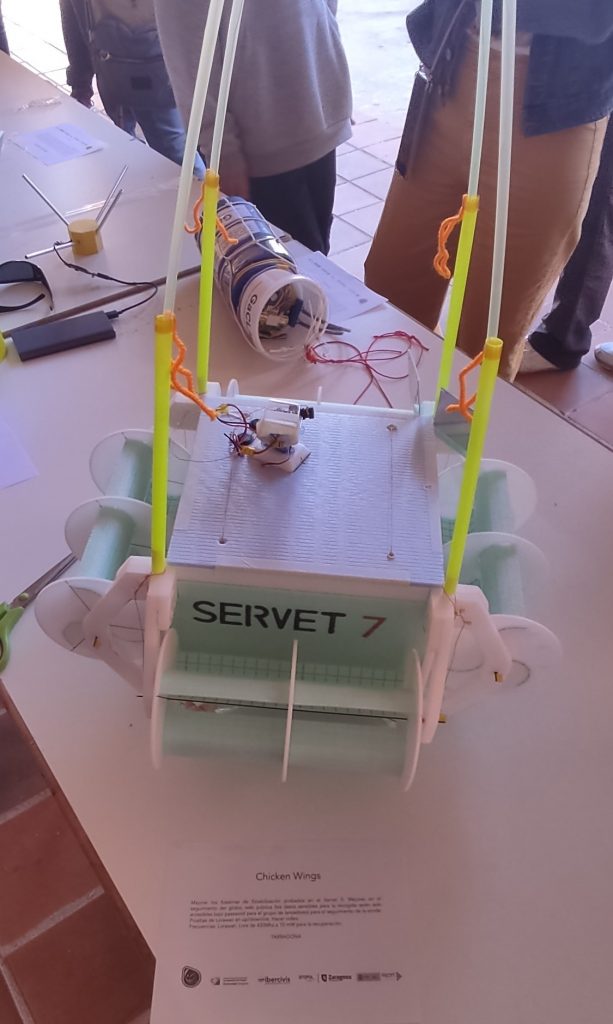
The stabilisation system based on the Magnus effect did not work as expected. The axles of the rollers ended up very worn and generated resonance in the probe. We already have improvements in mind.
Audio and video
The high-resolution 2.1K, 60 fps images have helped us understand what happened during the flight and visually confirm the operation of our own probe and of the other probes in the train.

GaCLA (Greenhouse Gas Concentrations in the Lower Atmosphere)
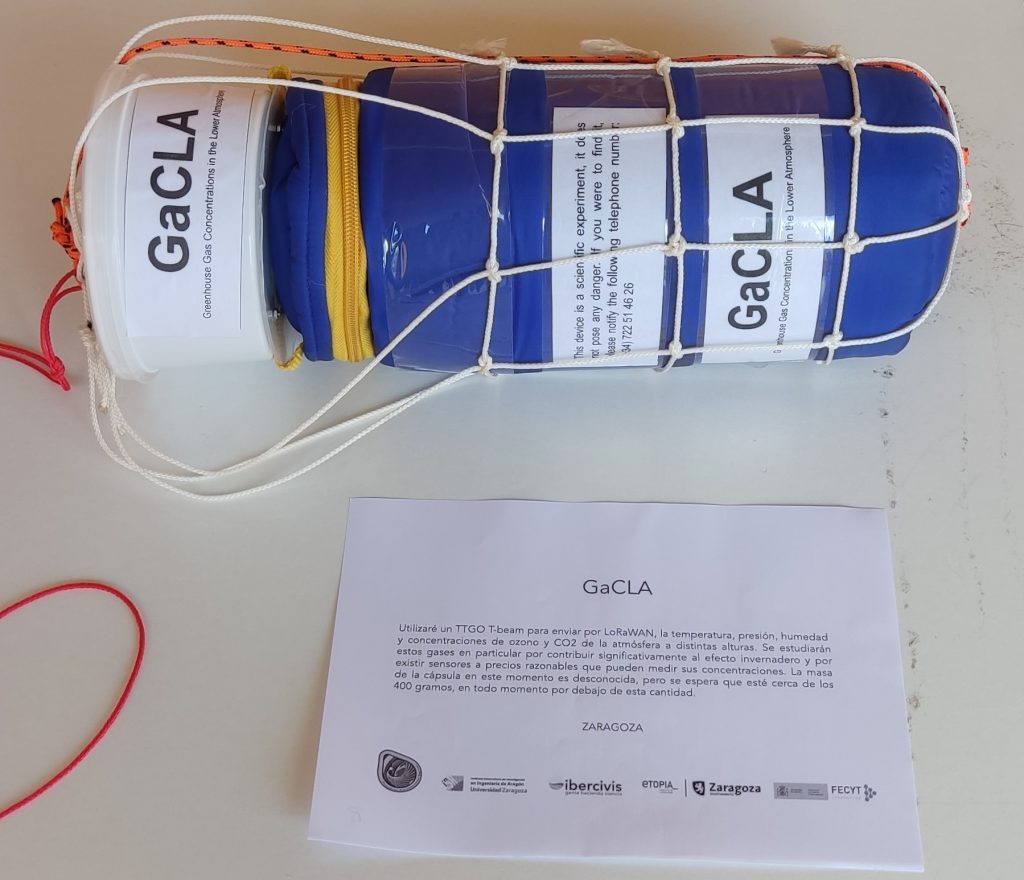
GaCLA (Greenhouse Gas Concentrations in the Lower Atmosphere) is a project whose aim is to measure three greenhouse gases (carbon dioxide, ozone and water vapour) at different heights in the lower atmosphere. To do this, a probe was built to collect these data along with temperature, pressure and GPS location (latitude, longitude and altitude) in order to put the collected data in context. As well as being stored locally, the data are sent by radio frequency using the LoRa and LoRaWAN protocols.
The capsule is made up of two TTGO T-Beam boards (ESP32-based microcontrollers that also include LoRa and LoRaWAN communication as well as GPS) and the various sensors to measure the gases in question: BME280 to measure temperature, pressure and relative humidity (from which the water vapour concentration can be obtained); MH-Z14A to measure the carbon dioxide concentration; and ZE25-O3 to measure the proportion of ozone. These sensors were chosen for their reliability given their low cost, since sensors able to take more precise measurements cost significantly more (over €250 each) in the case of the last two.
The launch was partially successful: the probe was recovered, all the sensors collected data and these were stored and transmitted by radio, but the values showed anomalies. First, the CO2 sensor did not record data below 400 ppm even though it supposedly could, and it was later observed that the carbon dioxide concentration rises with height, completely the opposite of what was expected. In addition, the ozone sensor recorded data with much more variability than expected at low altitudes, so the concentrations obtained by the sensor are not
reliable.
The problems in the CO2 measurements may be due to poor default programming of the sensor, so that it did not measure low concentrations. As for those from the ozone sensor, the cause is not very clear. Both sensors may also have given odd values because of cross-sensitivity to other gases and the abnormal pressure and temperature conditions met during the ascent and descent, since they are designed to work at the pressures and temperatures typical of the Earth’s surface.
In any case, the data collected by the CO2 and O3 sensors are not corrected for pressure. Because of the measurement technologies they use, what they measure is the absolute concentration of these gases and, taking a standard atmospheric pressure, they assume the total amount of gas in order to find the relative concentration, which is what they return (ppm of CO2 and ppb of O3). Because of these anomalies in the data, it was decided not to touch them up, to avoid adding further sources of error.
In conclusion, should an atmospheric gas measurement experiment be repeated, we would recommend that those carrying it out opt for sensors with optical technology (which quantify the light of a precise wavelength absorbed by the target gas) and, if possible, that they have some guarantee from the manufacturer that they can work at those pressures and temperatures.
Servet Wings
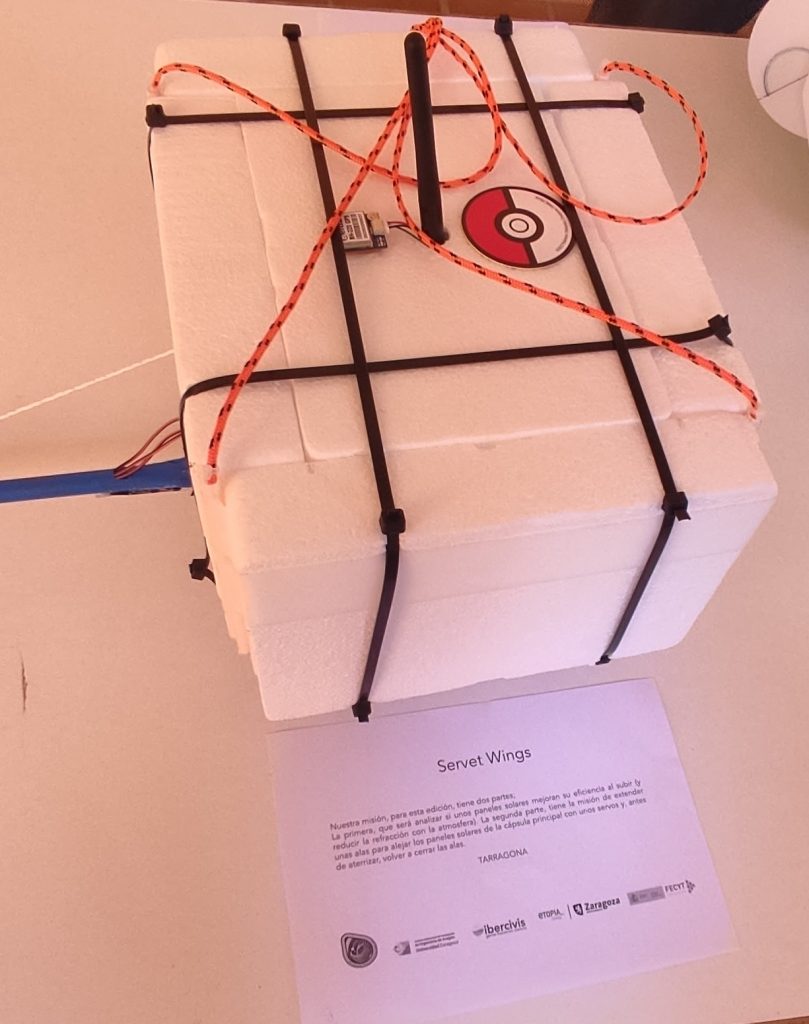
Because of last-minute problems we did not make any great discoveries during the flight; even so, we can confirm that radiation increased, though only a little, since it did not rise as much as we would all have liked. On the other hand, we tried to look into other mini-experiments:
The battery, without any extra thermal protection, would have stopped supplying power to the abort computer had it reached 35 km in altitude.
A simple analogue sensor with no chip works without problems at low temperature and keeps its accuracy.
Sitripio 1
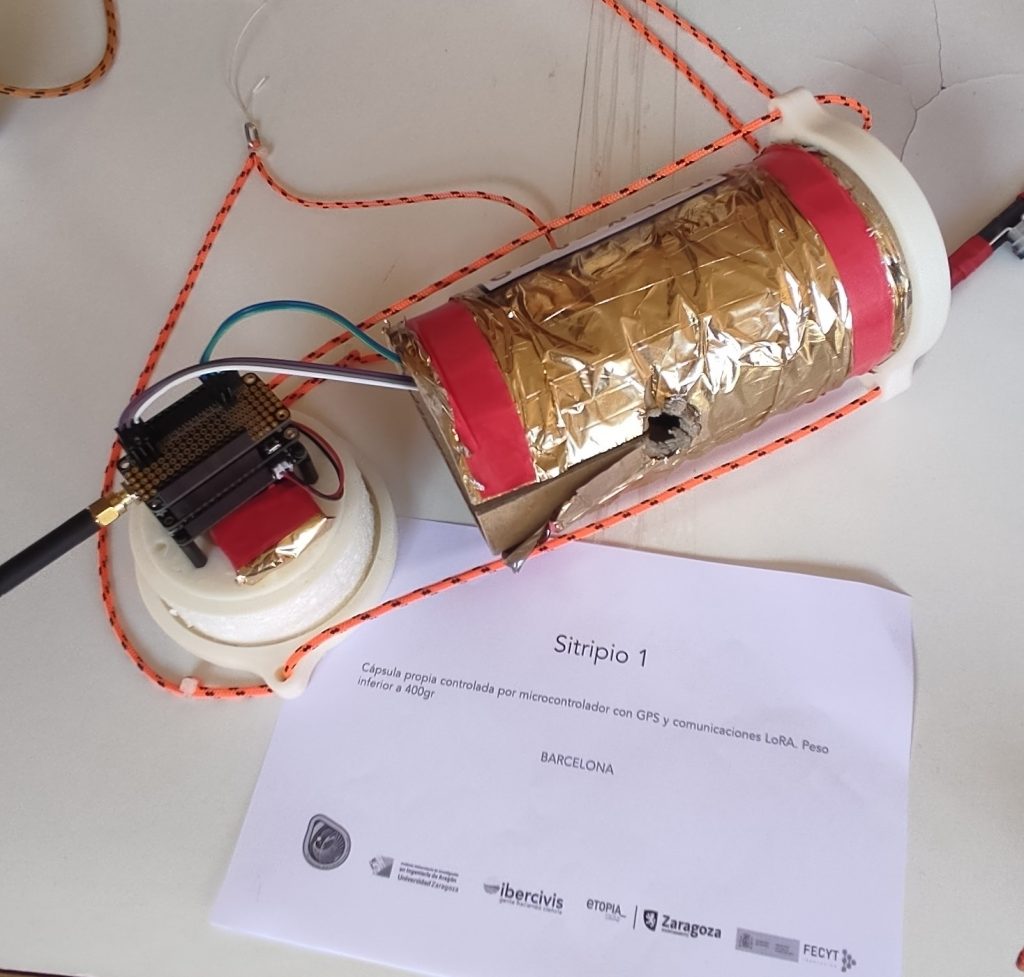
The Sitripio capsule (Barcelona) was intended as a technology demonstrator of a recently created microcontroller, the RP2040, connected by a radio-frequency system to The Things Network LoRaWAN network. The capsule was to transmit, at very low power, the processor’s internal temperature and the system’s GPS position.
In the hours before the launch there was a problem (still to be determined) with the radio module and the probe could not transmit its data correctly, but it has been confirmed that the on-board computer was still working after its flight through the stratosphere.
Although a little bittersweet because of the unexpected failure of the radio module, we believe the mission was almost a complete success, as the system survived the harshness of the stratosphere and the landing.
On future flights of the Servet Project the communication problems will have been solved and we will be able to consider it a complete success.
CRANGILANDER I
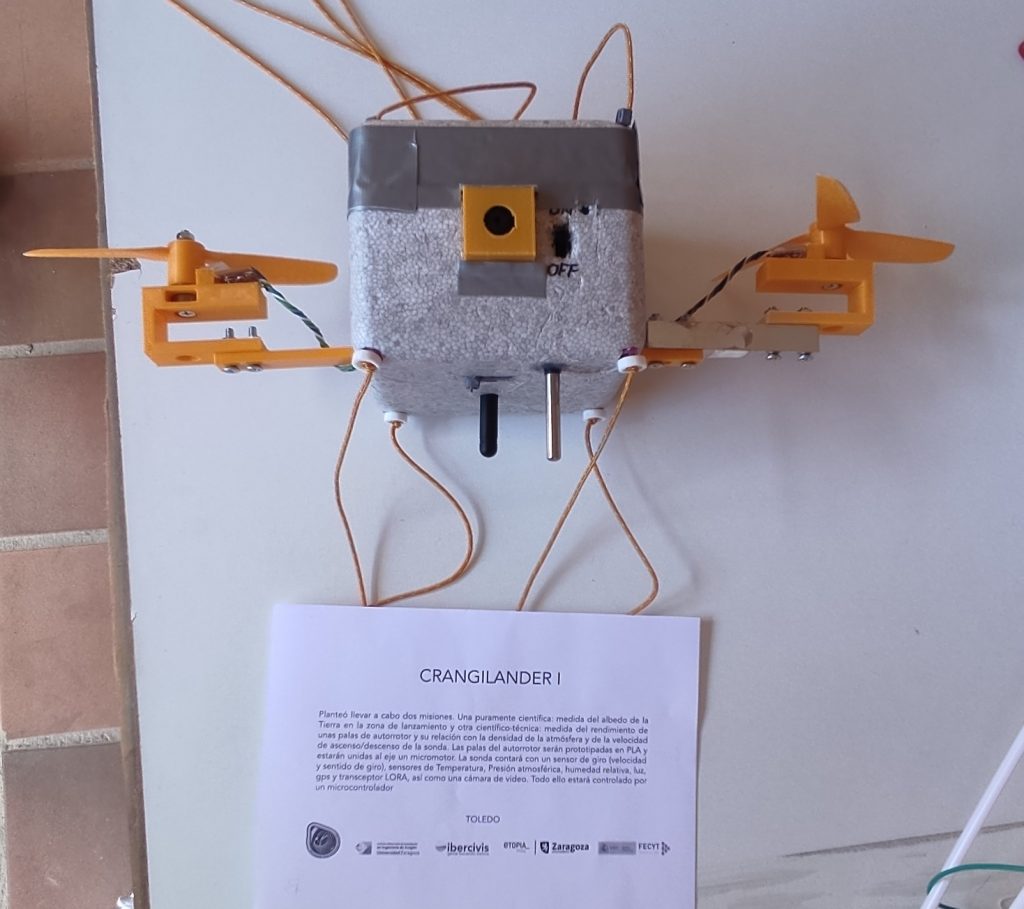
My selection in the SERVET VII call to develop scientific and technical experiments by citizens in a high-altitude environment has meant putting into practice (or trying to) some of the ideas I had been turning over in my head about possible autonomous landings of probes.
The main experiment was to test the capsule’s self-braking capacity using autorotors, as can be seen in this educational NASA video https://youtu.be/HrKRWsrZuYc
To do so I designed and built a capsule with two propellers, one with two blades and one with three, so that I could check the difference in performance between the two designs, measured as angular rotation speed.

To measure this rotation speed I used two encoders I designed by hand with A3144 Hall-effect sensors.
In addition, the three-blade propeller was coupled to a load cell in order to quantify the braking thrust produced by the rotation.
The CRANGILANDER I experiments also planned to measure the Earth’s albedo at these latitudes, but because I could not find sufficiently reliable light sensors I dropped that part of the experiment.
In addition to measuring the rotation speeds of the blades and the thrust exerted on one of them (the three-blade one), we measured the following physical parameters:
- Position (latitude, longitude, altitude) and time: GPS Neo 6M
- Atmospheric pressure: BMP180
- Capsule interior temperature: BMP180
- Exterior temperature: DS18B20
Indirectly we also measured:
- Ascent/descent speed
- Air density
The capsule also included a mini camera, but it ran out of battery before the ascent began.
To control all these sensors I used a Teensy 3.5 microcontroller, which can also save all the data obtained on a microSD card as a backup.

As well as saving the sensor data on the backup card, it was sent over LoRa at 868 MHz every 30 seconds to the ground station. This was achieved with a Dorji DRF1276DM module.
The ground station consisted of another of these modules connected to a mobile phone that read the transmitted data frames over the serial port.
Of the 208 data frames sent, 166 were received on the ground, which in my view is a good figure.
These were the most significant data from the flight:
| Quantity | Value | Unit |
| Launch altitude | 595.3 | m |
| Landing altitude | 388.1 | m |
| Maximum altitude | 25455.4 | m |
| Atm. pressure at surface | 956.56 | hPa |
| Minimum atm. pressure | 28.23 | hPa |
| T exterior at surface | 22.69 | ºC |
| T exterior minimum | -54.75 | ºC |
| T interior at surface | 33.2 | ºC |
| T interior minimum | -18.7 | ºC |
| Ascent time | 3643 | s |
| Descent time | 2696 | s |
| Total flight time | 6339 | s |
| Air density at surface | 1.1264 | Kg/m3 |
| Minimum air density | 0.0409 | Kg/m3 |
| Mean ascent speed | 6.83 | m/s |
| Mean descent speed | -9.30 | m/s |
| Max. rotation speed, three-blade | 5927.5 | rpm |
| Max. rotation speed, two-blade | 5017.5 | rpm |
| Max. thrust | 0.975296 | N |
| Min. thrust | -0.32389 | N |
A few graphs associated with the main experiment:
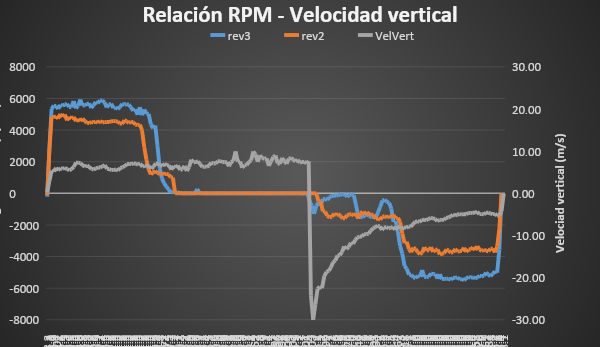
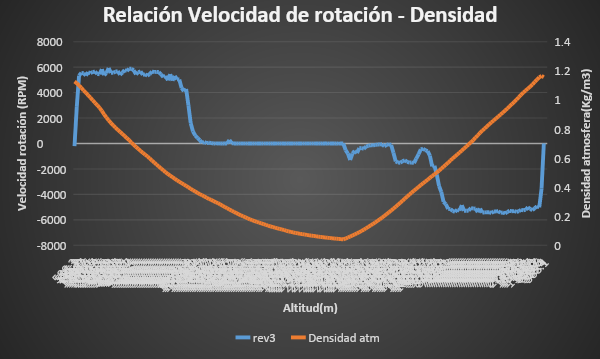

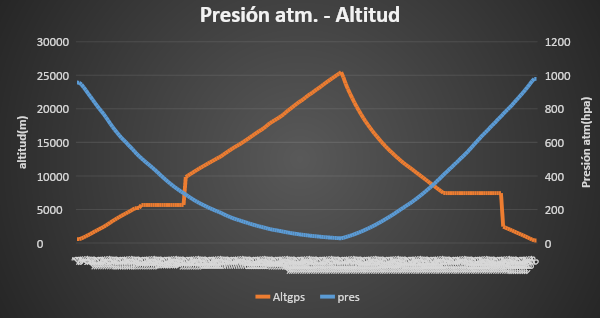
From the data and graphs obtained it can be seen that there was a period during the ascent (from 5,671 m to 9,839 m) and during the descent (from 7,843 m to 2,299 m) in which the GPS stopped sending new data, as it went from receiving 9 or 10 satellites to 0 in those stretches. I can find no explanation for this incident.
The exterior temperature sensor DS18B20 also stopped giving a temperature when it approached the minimum temperatures recommended by the manufacturer (in my case, perhaps because it was not an “official” sensor, it stopped giving data below -54.31ºC)
As for the rotation speeds of the blades, these remain more or less constant relative to the balloon’s ascent speed, 5,300 rpm for the three-blade and 4,400 rpm for the two-blade. However, once the air density drops below 0.43 Kg/m3 the rotation speed collapses, reaching 0 rpm when the air density is 0.35 Kg/m3.
From all this, we can conclude that the aerobraking effect could begin when the air density is about 0.5 Kg/m3, that is, at about 8,500 m in altitude, and reach its steady state at 7,500 m, which is when an average of 5,400 rpm is reached again on the three-blade propeller.
What I have not been able to confirm is that the thrust exerted by the autorotor is enough for braking. I believe this is because of poor design in this part of the experiment in several respects. One of them was not having taken into account that the capsule system was not an isolated system, as it travelled on the same train as the other capsules and parachutes and therefore was not in real “free fall”. The other problem was possibly the load cell measurements, as they did not seem very consistent throughout the flight.
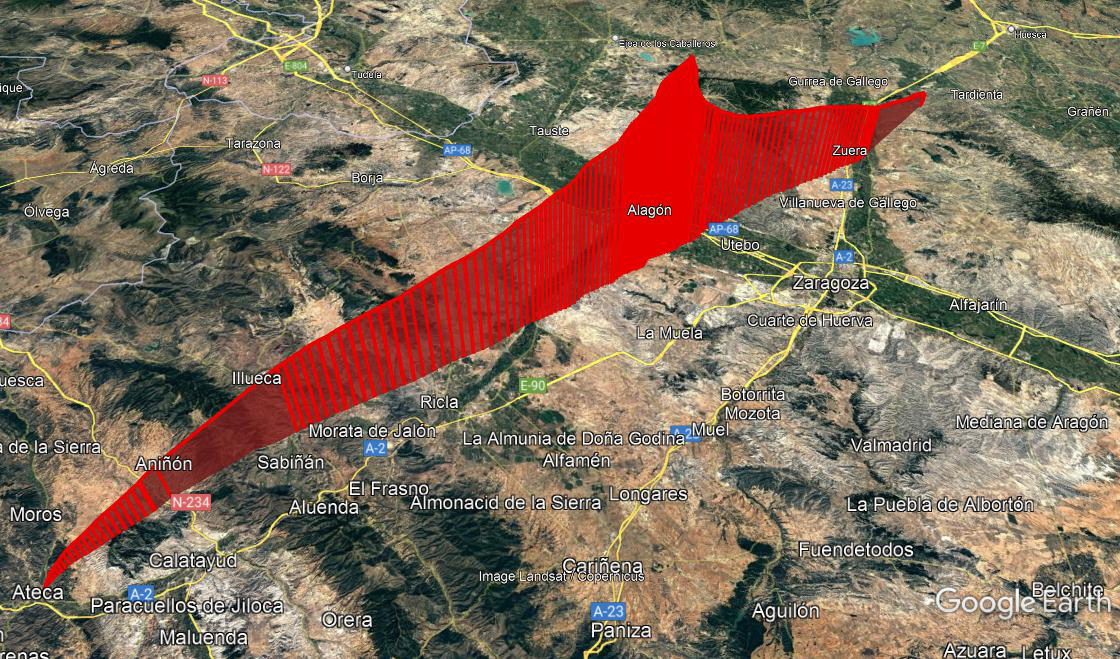
CONCLUSION
The Servet VII project has given me the opportunity to carry out experiments that would be difficult to do without the support of organisations such as Ibercivis. Moreover, doing it together with a group of citizens with similar interests, from whom I have learned a lot, is a not insignificant bonus.
PaPe3 + (uPape3A+uPape3B)
When pico balloons are launched from the ground, very little helium is usually used: if we use too much the balloon bursts, and if we use too little the balloon fills up with moisture that turns into ice and makes it fall.
The experiment consisted of carrying two pico balloons with very little helium, since, rising propelled by a high-altitude balloon and therefore ascending so fast, the formation of dangerous ice would be avoided.
With helium and a micro-probe of barely 10 g, the aim was to reach heights of around 12 km.
What is interesting at 12 km?
Jet streams, which are found between 9 km and 16 km and are a flow of air that circles the Earth at speeds between 90 and 400 km/h.
When a pico balloon reaches one of them it can circle the Earth in just a few days. Video.
Designing a mechanism to carry and release a fragile 10 g probe was a challenge and took longer than I had initially thought, and I finally opted for a gripper design operated by a small servo.
For the design I used the open-source application FreeCAD, printing parts with a 3D printer and using a laser cutter to obtain more precise gears.